












Figma radar chart components


Radar charts in Figma: axes, legends, and readability limits
A radar chart is one of the few charts people compliment on looks before they say what it shows. It turns up wherever several unrelated scores need to sit in one picture: skills assessments, product scorecards, security posture reports, player stats, vendor comparisons in a procurement deck.
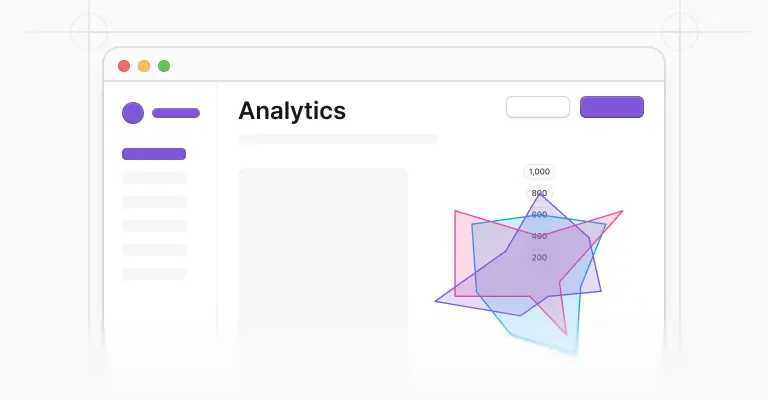
The 3 components and 12 variants above cover the plot, the grid, and the legend positions. Knowing where the format holds up is the part that takes longer.
What a radar chart is genuinely good at
Shape recognition, and very little else. Overlay one profile on another and the difference in outline registers before anyone reads an axis label, which is why radar works for "how is this team shaped compared to that one" and fails at "how much did support scores move".
Ask a viewer to name the value on any single axis and they will guess. Ask them which of two polygons is lopsided and they will be right immediately. Design around that split: use the chart for the impression and put the numbers somewhere they can be read, usually a table underneath.
The limits nobody designs around
Three of them are real and none of them are fixable with styling. The order you place the axes in changes the shape entirely, so the same data can look balanced or spiky depending on a layout decision you made for aesthetic reasons; Robert Kosara's argument against radar charts starts there, and adds that the lines joining the points imply a continuity that categorical axes do not have.
Area grows with the square of the radius, so a score twice as high looks four times as big, a distortion Data to Viz spells out alongside the overplotting problem.
Two series is the honest maximum here, three if the colors are far apart and the fills are transparent enough to see through. If you need five, you needed small multiples or a plain bar chart.
One plot size, three legend positions
There is one size, and that is deliberate. The plot is 392px wide and 372px tall with the legend switched off.
Setting the legend to the right takes the component to 478px wide; setting it below takes it to 408px tall. Radar charts do not shrink gracefully, because the axis labels sit outside the polygon and are the first thing to collide when the frame gets narrow.
If a dashboard card cannot give you 392px, that card wants a different chart rather than a smaller radar. Every frame in the file exists twice, once light and once dark, so the grid rings and fills are tuned for dark surfaces instead of inverted into them.
Legend variants and axis order
The chart is a component set with Legend as its only variant property, so the three arrangements swap from the properties panel like any other Figma variant, with no size or style permutations to hunt through. The thing worth settling before handoff is the axis order, which should follow something the reader already understands, like a funnel sequence or a scorecard's published order, so the shape means the same thing on every screen it appears on.
Alongside the pie charts and activity gauges, it fills in the data shapes that lines and bars leave out of a dashboard.
When it is time to build, the same charts exist in code. Untitled UI React radar charts are open source, built with Tailwind CSS, with the axis and grid maths handled so you are not plotting polygon points by hand.
Frequently asked questions
What is a radar chart used for?
Comparing profiles across several dimensions at once, where the shape matters more than any individual value. Skills matrices, product scorecards, and posture assessments are the common cases.
It is a poor choice for tracking change over time, or for any comparison where the reader needs the actual numbers rather than a silhouette.
How many data series can a radar chart show?
Two comfortably. Three if the colors are far apart and the fills are transparent.
Beyond that the polygons cross each other so often that no individual series can be traced, and the chart becomes a texture. When you have five profiles to compare, draw five small radar charts side by side rather than one crowded plot.
Does the order of the axes matter?
More than most people expect.
The same numbers produce a smooth shape in one axis order and a spiky one in another, so the arrangement is a real editorial decision rather than a layout preference. Pick an order the reader already knows, such as a funnel sequence or the order used in your reporting, and keep it identical across every chart in the product.
Are these radar chart components free?
Yes. The radar charts are part of the 100% free version of Untitled UI and can be used in personal and commercial work.
The full Figma kit takes the same system out to 10,000+ components, page examples, and dashboards.
Is there a React version of these radar charts?
Yes. Untitled UI React radar charts are open source, built with Tailwind CSS, and match these Figma components, so the plot your developers render has the same grid, fills, and legend placement you designed.
Foundation Figma components and styles
Figma base components
Shared Figma assets
Application UI/Dashboard examples
Application UI/Dashboard Figma components
Marketing website examples
What is Untitled UI?



















Untitled UI is the best $ I've spent on my business in a long time. I'm going to keep using it and recommending it to every designer I know.


Over the years we've featured hundreds of UI kits on UXCrush, but Untitled UI is by far the most comprehensive and detailed I've seen yet. A must have for any designer!

I've used all UI kits on the market. I can say without a doubt that the Untitled UI kit is the best on the market. It covers everything a designer needs in a modern and efficient way.

Incredible, and keeps getting better. I’ve tried dozens of UI kits and Untitled UI is the only name you should care about. It stands head and shoulders above the rest.

Such a beautiful, detailed, and extensive UI kit. Untitled UI is the perfect foundation for any project. I highly recommend this huge time saver.
Untitled UI has been an amazing resource that I'm learning to rely upon to spin up ideas in no time. I think I might launch a startup pretty soon by mistake here!

The sheer scale, details, and organization of this kit is mind-blowing. It covers nearly everything a Designer could need in a modern, efficient and systematic way.

I'm super impressed with this. I love poking around in other peoples UI Kits to see how they think. This is probably one of the most comprehensive I've seen.

I'm super excited to use this for quick mockups of ideas in Figma. We're always trying to streamline our design process so we can move fast! Definitely recommend.

Untitled UI is easily the best UI kit I've used so far. It has an insane amount of components that are all incredibly well-built. I don't even know how many hours this will save.

The attention to detail and thought Jordan has put into this UI kit is unparalleled.

Untitled UI is incredibly well-organized and the attention to detail is great. I highly recommend this kit to any designer that wants to create beautiful designs fast.

What an awesome Figma kit... it's an absolute game changer. This is the perfect base for any design system. The size and attention to detail is next level.

We've been using Untitled to build Himalayas 2.0 and have finished a complete redesign in just a few days. It has everything we need already pixel-perfect.