











Figma line & bar chart components


Line and bar charts in Figma: data viz without plugins
Figma has no chart tool. Every graph you've ever seen in a Figma file was either drawn by hand, generated by a plugin, or assembled from components, and the choice between those three quietly decides how maintainable your dashboards are six months from now.
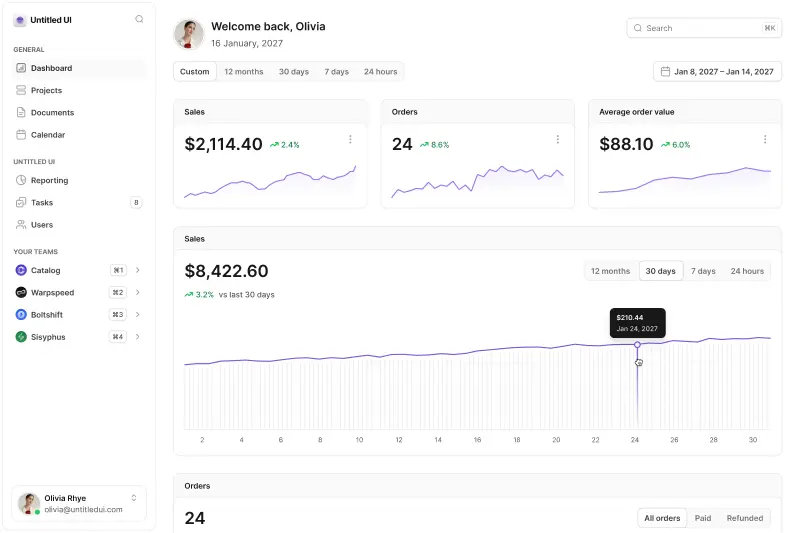
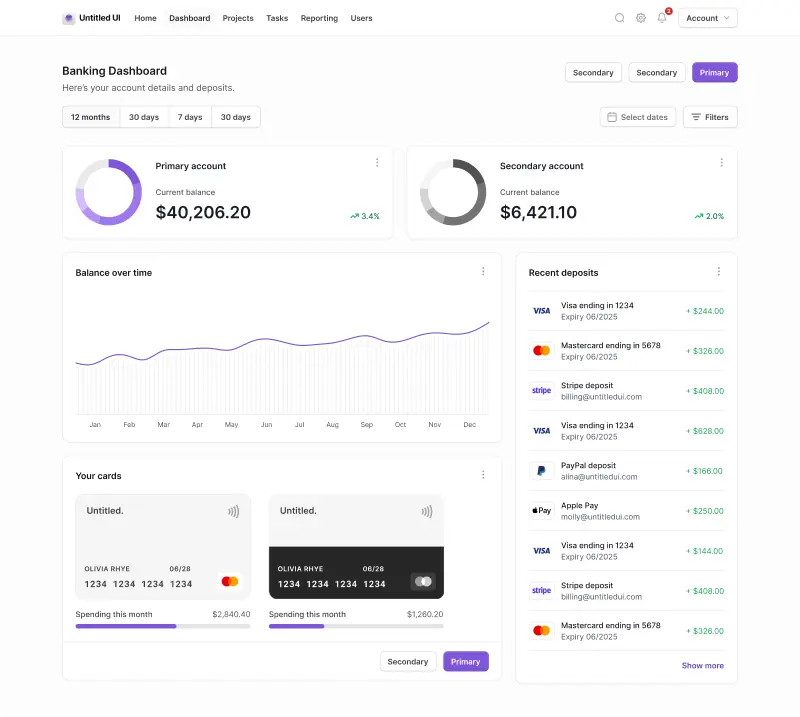
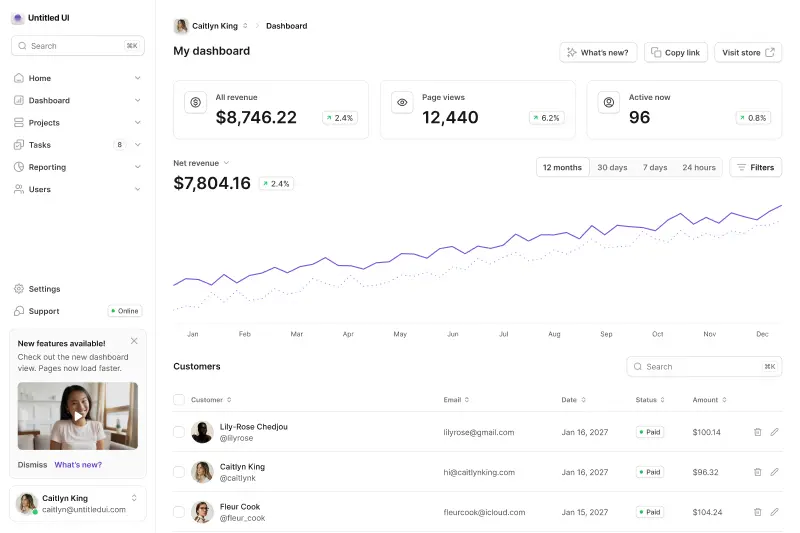
The 9 chart components and 116 variants above take the component route, and here's why that's usually the right call.
Plugins make data, components make systems
Chart plugins are great at one thing: turning a real CSV into an accurate one-off graph. What they can't do is match your design system, restyle when your brand changes, or stay consistent across forty dashboard screens designed by three people.
Component charts flip the tradeoff: the data is illustrative rather than precise, but every chart in the file shares the same styles, spacing, and behavior, which is what product design work actually needs. When a stakeholder needs the real numbers plotted, that's a job for the actual product, not the mockup.
The honest division of labor: components for design work, plugins for the occasional accurate one-off, and never hand-drawn vectors that nobody can edit later.
Line or bar?
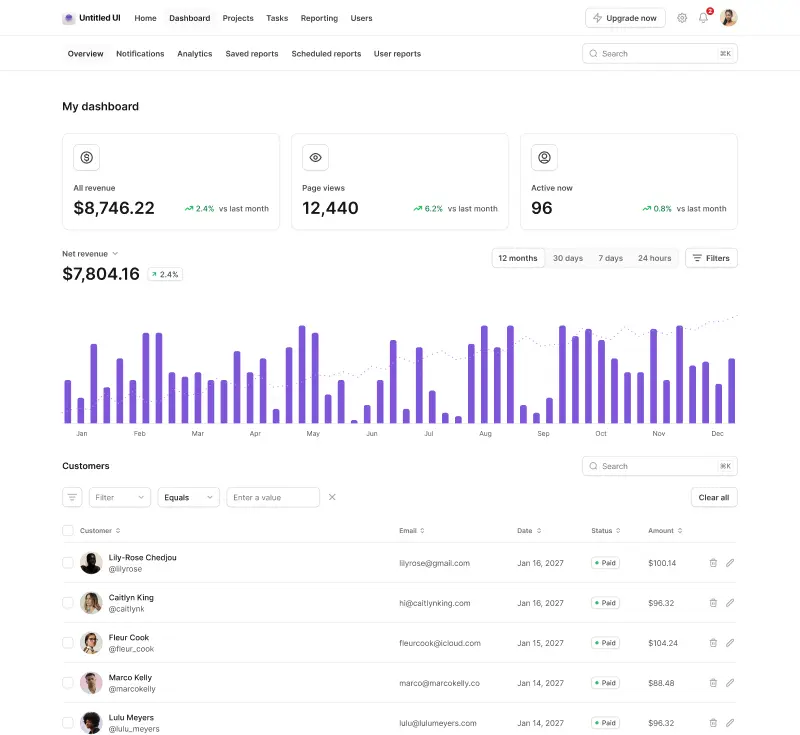
The oldest rule in data viz still decides it: lines for trends over time, bars for comparisons between categories. Nielsen Norman Group's chart-type guidance covers the reasoning. Both styles live in one component here, so switching is a property flip.
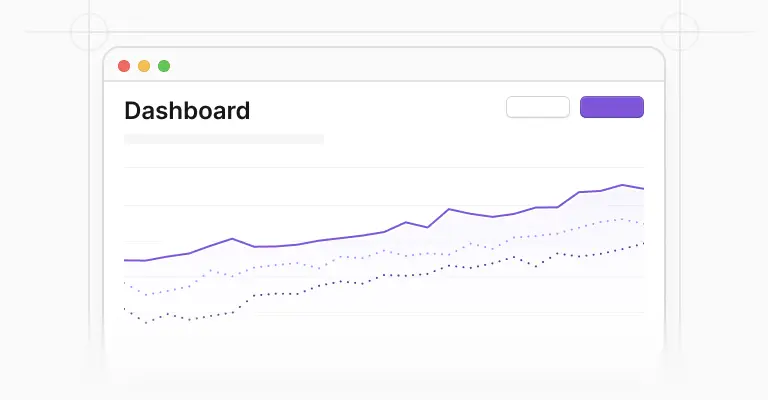
The line charts come with 12 swappable data curves in gradual, wavy, and volatile personalities, plus dedicated bar data sets, so your revenue chart can look plausibly like revenue instead of a perfect sine wave that screams "placeholder".
The x-axis component switches between 7 day, 30 day, and 12 month ranges to match, and the y-axis labels toggle independently, so the same chart works as a detailed report figure or a stripped-back trend line.
Anatomy you can toggle
Legends (top, right, or none), axis labels (on or off), and chart markers in line, minimal, and dash styles are all component properties, and each chart has a desktop version sized for dashboard cards and a compact mobile version.
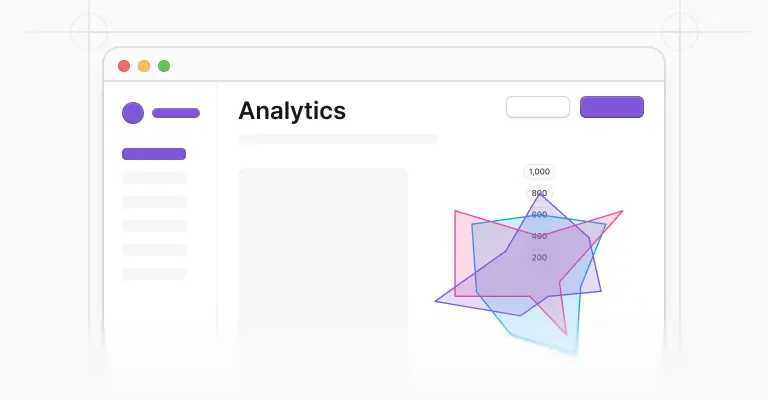
That toggle-based anatomy is what makes the charts fit anywhere: strip the axes and legend for a sparkline-ish card in a metrics row, or run the full treatment in a dashboard's main chart. The pie charts, radar charts, and activity gauges round out the family for the data shapes lines and bars don't cover.
Accessible data viz
Two WCAG rules do most of the work in chart design. Use of color: never let hue alone separate two series, so label lines directly or vary the markers, which is one reason the marker styles exist.
And non-text contrast: strokes and bars need 3:1 contrast against their background, which gets genuinely hard in dark mode where thin bright lines start to vibrate. Both the light and dark versions of these charts are tuned with that in mind, so the dark dashboards don't quietly fail the contrast checks the light ones pass.
When it's time to build, the same charts exist in code. Untitled UI React charts are open source, built with Tailwind CSS, matching these components so the dashboard your team ships looks like the one you designed.
Frequently asked questions
Does Figma have built-in chart components?
No. Figma has no native charting, which is why every chart is either hand-drawn, plugin-generated, or a component.
These components give you the third option: charts that behave like every other part of your design system, restyle with your tokens, and resize with Auto Layout, with realistic placeholder data built in.
Should I use a chart plugin or chart components?
Plugins when the exact numbers matter, like plotting a real dataset for a report. Components when consistency matters, which is most product design work: dashboards, marketing screenshots, and prototypes where the chart's job is to look right and match the system.
Many teams use both, with components in the design system and plugins for one-off accuracy.
How do I change what the chart data looks like?
Swap the data curve. The line charts include 12 interchangeable curves across gradual, wavy, and volatile styles, and the bar charts have their own data sets, so picking a different mood for the data is a variant swap.
The x-axis flips between 7 day, 30 day, and 12 month ranges to keep the labels believable.
Are these chart components free?
Yes. The line and bar chart components are included in the 100% free version of Untitled UI, usable in personal and commercial projects.
The full Figma kit extends the same system to 10,000+ components, page examples, and full dashboards.
Is there a React version of these charts?
Yes. Untitled UI React charts are open source, built with Tailwind CSS, and mirror these Figma components, so design mockups and the shipped dashboard stay visually in sync.
Foundation Figma components and styles
Figma base components


Shared Figma assets

Application UI/Dashboard examples
Application UI/Dashboard Figma components
Marketing website examples



What is Untitled UI?



















Untitled UI is the best $ I've spent on my business in a long time. I'm going to keep using it and recommending it to every designer I know.


Over the years we've featured hundreds of UI kits on UXCrush, but Untitled UI is by far the most comprehensive and detailed I've seen yet. A must have for any designer!

I've used all UI kits on the market. I can say without a doubt that the Untitled UI kit is the best on the market. It covers everything a designer needs in a modern and efficient way.

Incredible, and keeps getting better. I’ve tried dozens of UI kits and Untitled UI is the only name you should care about. It stands head and shoulders above the rest.

Such a beautiful, detailed, and extensive UI kit. Untitled UI is the perfect foundation for any project. I highly recommend this huge time saver.

Untitled UI has been an amazing resource that I'm learning to rely upon to spin up ideas in no time. I think I might launch a startup pretty soon by mistake here!

The sheer scale, details, and organization of this kit is mind-blowing. It covers nearly everything a Designer could need in a modern, efficient and systematic way.

I'm super impressed with this. I love poking around in other peoples UI Kits to see how they think. This is probably one of the most comprehensive I've seen.

I'm super excited to use this for quick mockups of ideas in Figma. We're always trying to streamline our design process so we can move fast! Definitely recommend.

Untitled UI is easily the best UI kit I've used so far. It has an insane amount of components that are all incredibly well-built. I don't even know how many hours this will save.

The attention to detail and thought Jordan has put into this UI kit is unparalleled.

Untitled UI is incredibly well-organized and the attention to detail is great. I highly recommend this kit to any designer that wants to create beautiful designs fast.

What an awesome Figma kit... it's an absolute game changer. This is the perfect base for any design system. The size and attention to detail is next level.

We've been using Untitled to build Himalayas 2.0 and have finished a complete redesign in just a few days. It has everything we need already pixel-perfect.