











Figma dashboard examples


Dashboard design in Figma: layout, charts, and best practices
Dashboards are where product design gets hard. A marketing page can hide behind big type and white space. A dashboard has to present dense, live data to someone who checks it every day and needs answers in seconds.
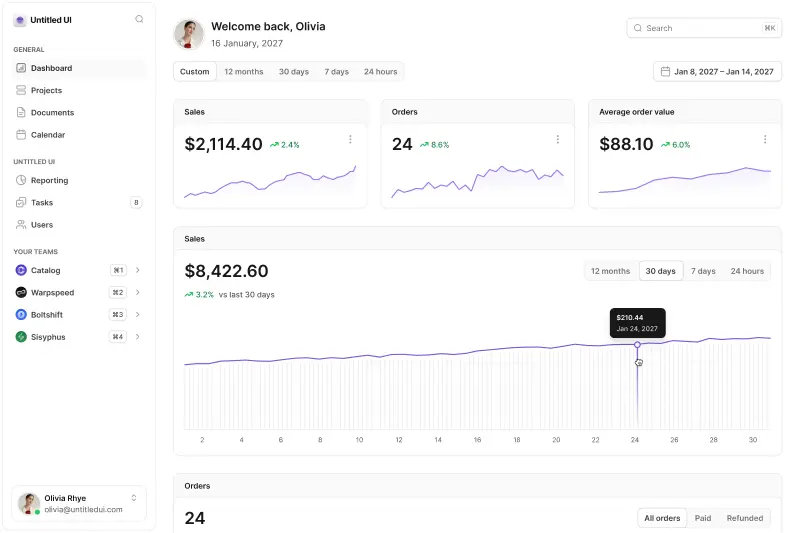
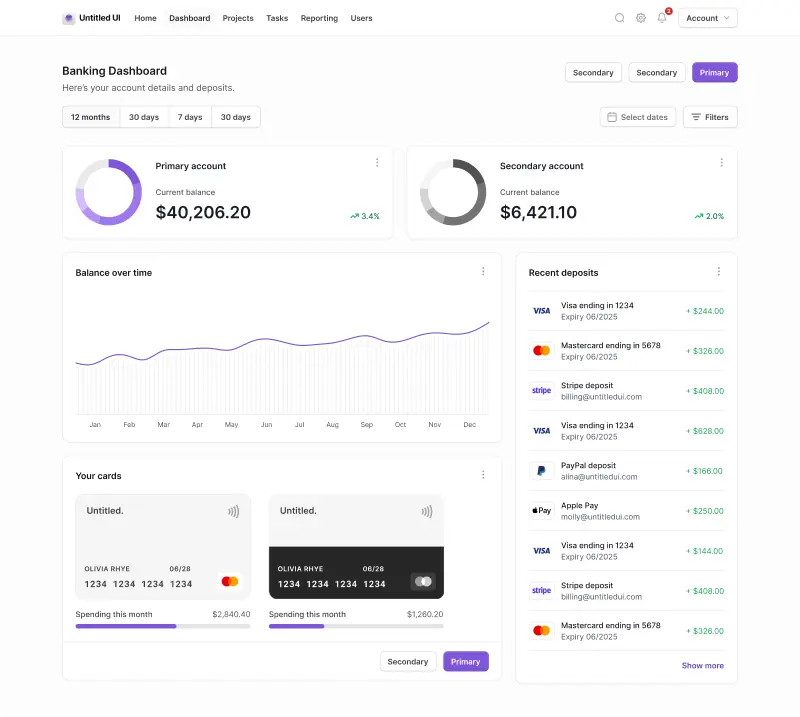
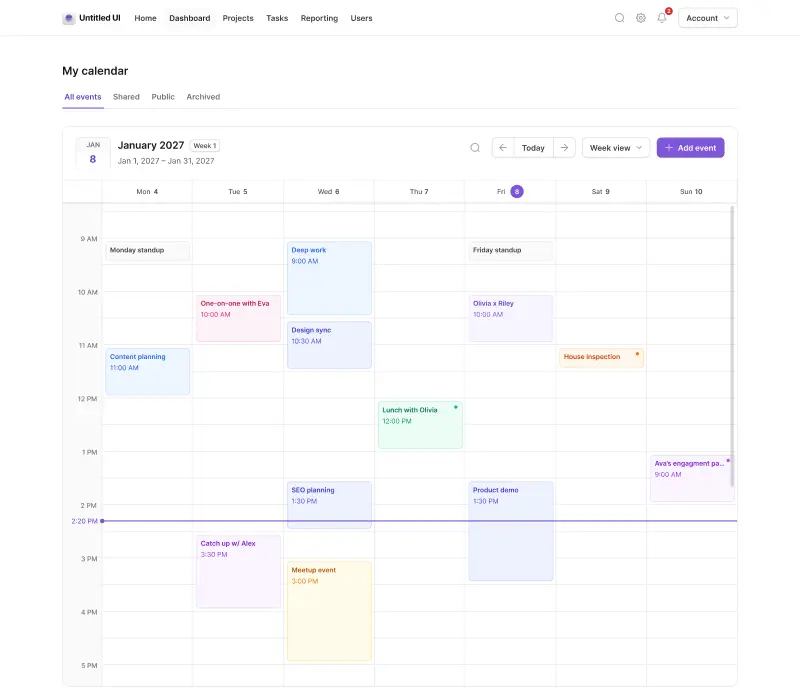
The dashboard examples above are built from the same components, styles, and design tokens as the rest of Untitled UI, and every one comes in light and dark mode with matching desktop and mobile versions. Drop one into your project, swap the charts and metrics for your own, and you're shipping something that looks like a mature SaaS product from day one.
The anatomy of a well-designed dashboard
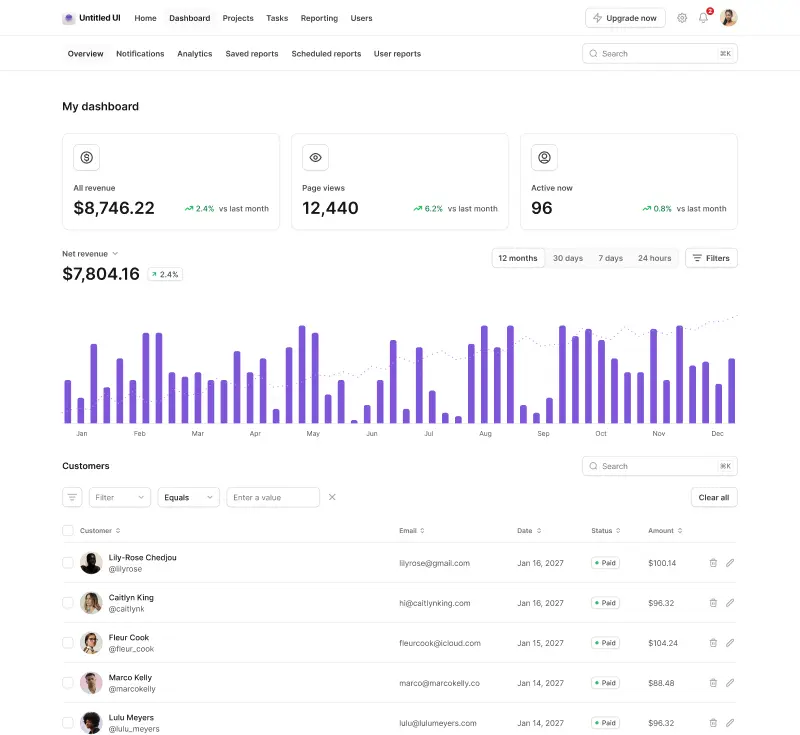
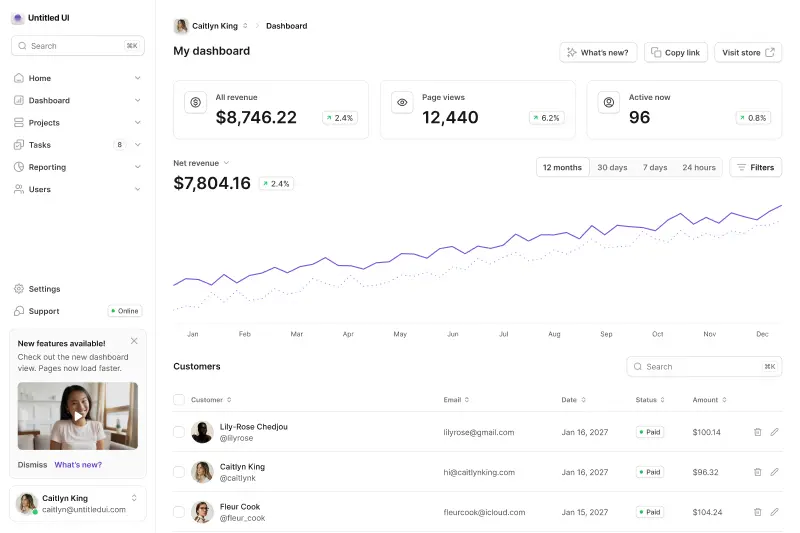
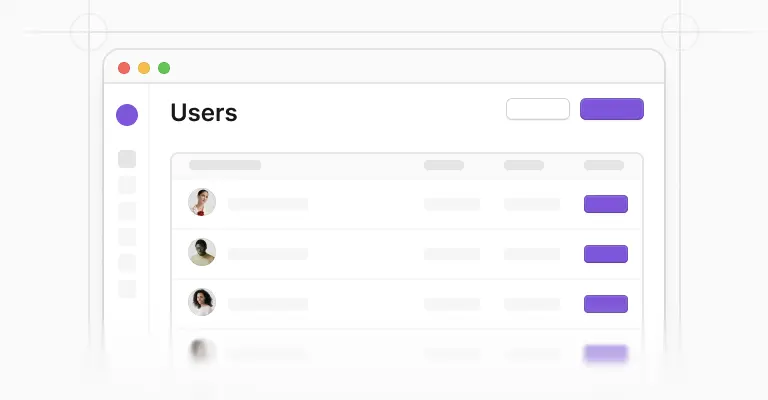
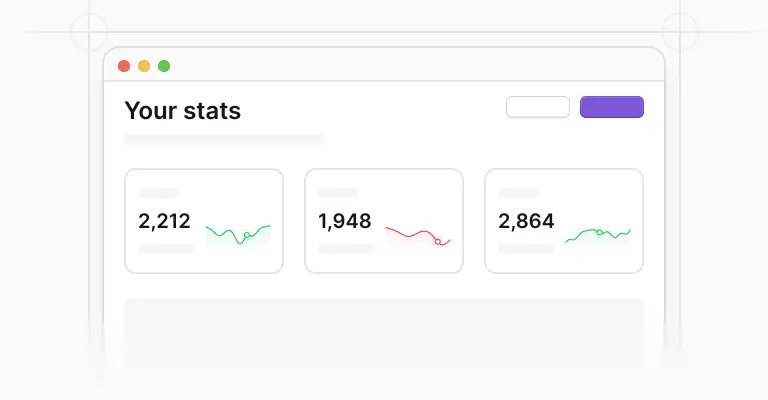
Almost every good dashboard is assembled from the same building blocks: a sidebar navigation or header navigation, a page header with a title and key actions, a row of metric cards for headline KPIs, a grid of charts, and usually a data table or activity feed underneath.
What separates a polished dashboard from a cluttered one isn't the components. It's the hierarchy. Lead with the three to five numbers your users actually care about, give your charts room to breathe, and push secondary detail behind tabs, filters, or drill-downs rather than cramming everything above the fold.
Every example in this set follows that structure, so you can mix sections between dashboards. Take the metrics row from one and the chart grid from another, and the spacing and type styles stay consistent.
Choosing the right charts for your data
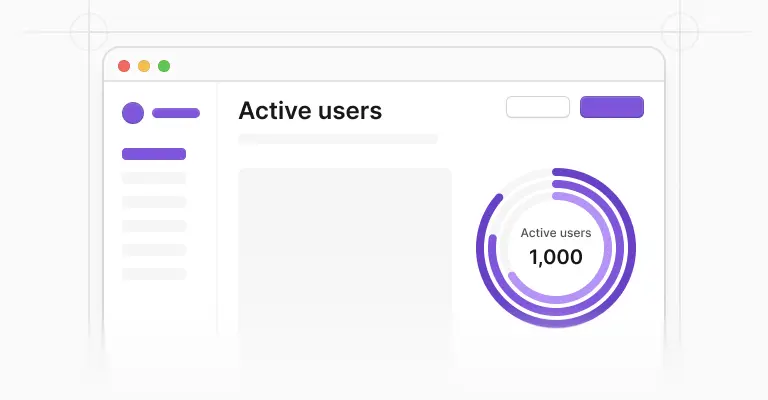
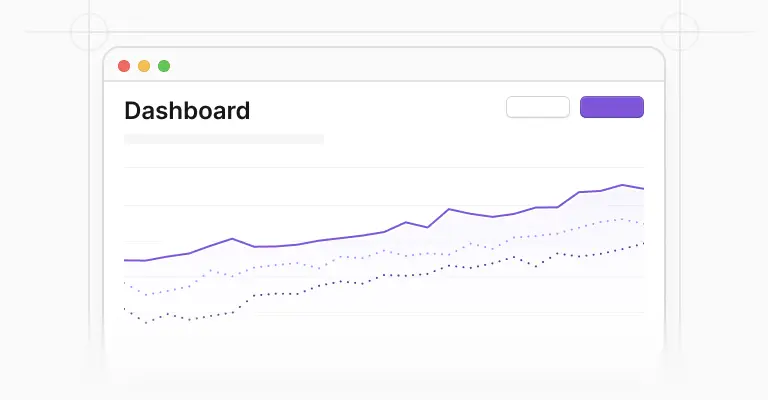
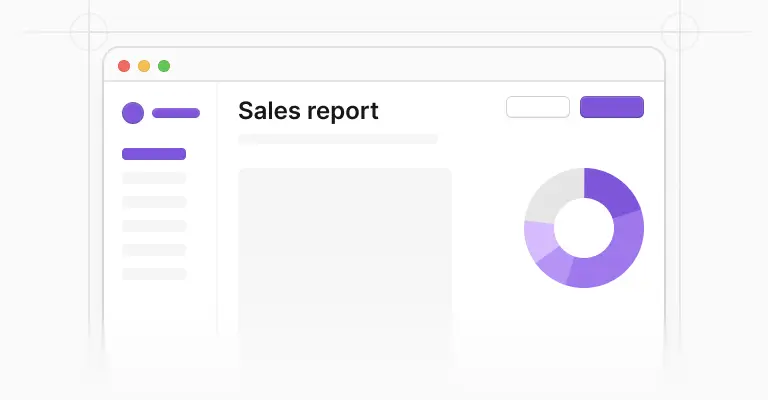
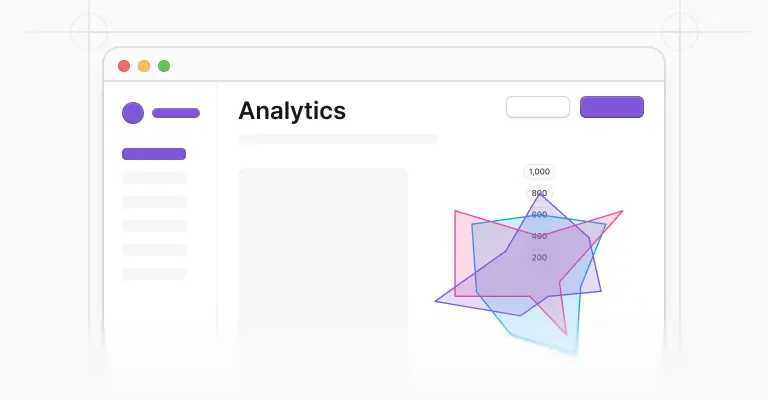
Figma has no native charting tools, which is why every chart in these dashboards is a real, editable component: line and bar charts, pie charts, radar charts, and activity gauges, all built with Auto Layout and ready to restyle.
Line charts suit trends over time, bar charts suit comparisons between categories, and pie or donut charts only earn their place when a handful of parts genuinely sum to a whole. Research from Nielsen Norman Group shows people read length and position far faster than they read areas or angles, so when in doubt, a boring bar chart beats a clever circular one.
And never let color be the only thing separating two data series. WCAG 1.4.1 exists because a meaningful share of your users won't see the difference, so label lines directly or vary the marker shapes as well.
Making dashboards responsive with Auto Layout
The most common question we see from designers building dashboards is what size to design at. Start at 1,440px, which is Figma's default desktop frame and the width every desktop example in this set is designed at. Then check your layout at 1,280px and 1,024px, because dashboards spend most of their life on cramped laptop screens rather than the big monitors we design on.
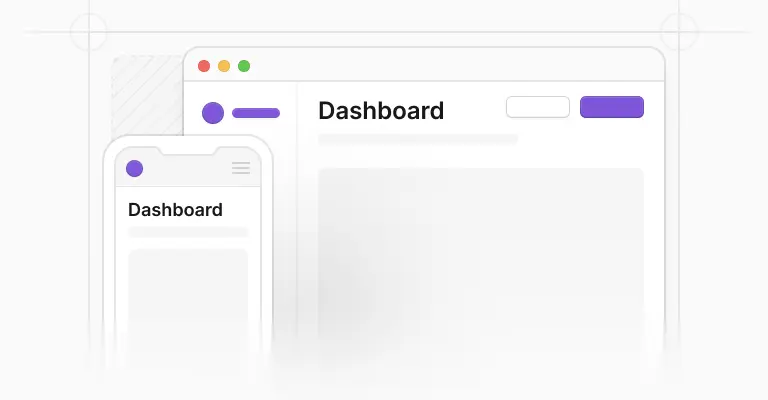
Each dashboard here also includes a 375px mobile version, so you're not left guessing how a metrics row or chart grid should collapse on a phone.
Responsiveness is where Auto Layout earns its keep. These examples are built with 100% Auto Layout, which means you can resize a dashboard and watch it reflow instead of manually nudging every card. Add a fourth metric card and the row makes room for it.
Designing dashboards for dark mode
Every dashboard in this set ships in both light and dark mode, designed as proper pairs rather than one version with its colors inverted. Dark dashboards need that care. Thin 1px chart strokes and saturated fills that look crisp on white can vibrate or disappear on dark surfaces, so the dark versions are tuned for dark surfaces specifically.
And because colors are applied through Untitled UI's color styles and design tokens, rebranding a dashboard to your product's palette means updating a handful of styles rather than hunting down hundreds of hardcoded fills.
When it's time to build, the same dashboards exist in code. Untitled UI React includes open-source dashboard examples built with Tailwind CSS and React Aria, using the same design tokens as the Figma kit, so what your team ships actually matches what you designed.
Frequently asked questions
What size should I design a dashboard in Figma?
Start at 1,440px wide, which is Figma's default desktop frame and the width every desktop example in this set uses. Then check your layout at 1,280px and 1,024px, since dashboards spend most of their life on laptop screens.
Every example here also includes a 375px mobile version, so the hard responsive decisions are already made for you.
How many metrics should a dashboard show?
Lead with three to five headline KPIs, the numbers your users check every day, and let everything else live in charts, tables, or drill-downs below. A dashboard that tries to show 20 equally weighted numbers effectively shows none.
The metric card components in these examples are designed for that top row: value, trend indicator, and comparison period at a glance.
Does Figma have built-in chart components?
No. Figma has no native charting tools, so every chart has to be drawn or imported as a component.
These dashboards include real, editable chart components: line and bar charts, pie charts, radar charts, and activity gauges, all built with Auto Layout so you can restyle and resize them like any other component.
Are these dashboard examples included in the free version?
The dashboard examples are part of the paid Untitled UI Figma kit. See pricing for what's included.
If you want to try the design system first, the 100% free Figma UI kit includes core components and styles from the same system, so anything you start with it upgrades cleanly.
Is there a React version of these dashboards?
Yes. Untitled UI React includes open-source dashboard examples built with Tailwind CSS and React Aria, using the same design tokens and components as the Figma kit.
So your developers can build the dashboard you designed rather than an approximation of it.
Foundation Figma components and styles
Figma base components

Shared Figma assets
Application UI/Dashboard examples
Application UI/Dashboard Figma components
Marketing website examples


What is Untitled UI?



















Untitled UI is the best $ I've spent on my business in a long time. I'm going to keep using it and recommending it to every designer I know.


Over the years we've featured hundreds of UI kits on UXCrush, but Untitled UI is by far the most comprehensive and detailed I've seen yet. A must have for any designer!

I've used all UI kits on the market. I can say without a doubt that the Untitled UI kit is the best on the market. It covers everything a designer needs in a modern and efficient way.

Incredible, and keeps getting better. I’ve tried dozens of UI kits and Untitled UI is the only name you should care about. It stands head and shoulders above the rest.

Such a beautiful, detailed, and extensive UI kit. Untitled UI is the perfect foundation for any project. I highly recommend this huge time saver.

Untitled UI has been an amazing resource that I'm learning to rely upon to spin up ideas in no time. I think I might launch a startup pretty soon by mistake here!

The sheer scale, details, and organization of this kit is mind-blowing. It covers nearly everything a Designer could need in a modern, efficient and systematic way.

I'm super impressed with this. I love poking around in other peoples UI Kits to see how they think. This is probably one of the most comprehensive I've seen.

I'm super excited to use this for quick mockups of ideas in Figma. We're always trying to streamline our design process so we can move fast! Definitely recommend.

Untitled UI is easily the best UI kit I've used so far. It has an insane amount of components that are all incredibly well-built. I don't even know how many hours this will save.

The attention to detail and thought Jordan has put into this UI kit is unparalleled.

Untitled UI is incredibly well-organized and the attention to detail is great. I highly recommend this kit to any designer that wants to create beautiful designs fast.

What an awesome Figma kit... it's an absolute game changer. This is the perfect base for any design system. The size and attention to detail is next level.

We've been using Untitled to build Himalayas 2.0 and have finished a complete redesign in just a few days. It has everything we need already pixel-perfect.