










Figma marketing website metrics sections


Metrics section design in Figma: numbers, layouts, and proof
A metrics section is three or four large numbers in a row, usually sitting under a hero, above a footer, or partway down an about page. Laying one out takes about ten minutes.
Deciding what belongs in it takes considerably longer, because no amount of layout answers the question underneath. Is the number actually impressive to the person reading it?
Numbers that help and numbers that hurt
Social proof cuts both ways. NN/g's work on social proof in the user experience makes the downside concrete: a count that reads as small does more damage than no count at all, and test participants dismissed content on exactly that basis.
"1,200 users" beside a competitor's "2 million" is an argument against you, published in your own type. If the absolute numbers are small, change the axis. Rates, ratios, and durations hold up at any scale: 99.98% uptime, 4.9 average rating, twelve minutes to first deploy.
And every figure has to survive somebody checking it. Upfront disclosure is one of the four credibility factors NN/g keeps finding, and an unqualified "10x faster" with no definition attached costs more trust than the claim buys.
Anatomy of a metric item
The figure and its label are one sub-component, 384px across in the desktop grid and 343px on mobile, with five types: a small accent line above the number, a small featured icon, centered and left-aligned versions that add a line of supporting text, and a card version at 312px that boxes each metric in its own container.
Keep the label to a noun phrase. "Active teams" works; "We now have active teams using the platform" is a sentence pretending to be a label. Set the figures in tabular numerals where the typeface offers them so a row of numbers lines up instead of jittering, since Figma exposes a font's OpenType features on the text layer.
The supporting text variants earn their place whenever a number needs a unit or a date to mean anything, which is most of the time.
Section layouts, quiet to loud
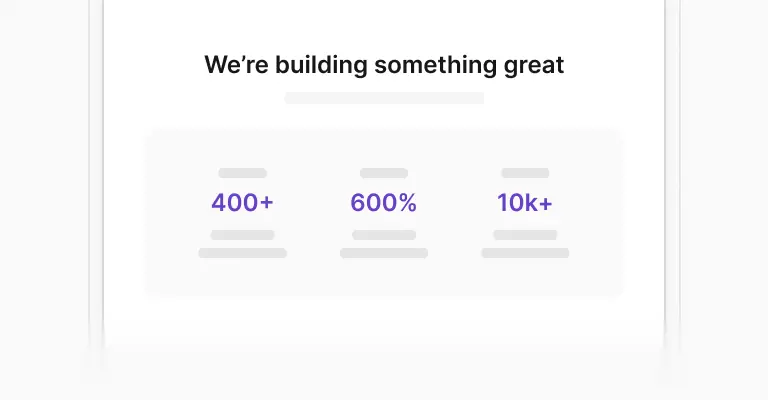
At the quiet end, the minimal centered text layout is 432px tall on desktop and is nothing but a row of figures. The simple accent line version is 562px and adds a heading and a paragraph above the row.
Above those sit the card layouts in gray light and brand dark, split image versions that set the numbers beside a photograph, image with cards, and two layouts that add buttons underneath for pages where the numbers are the argument for clicking. Several of the layouts also ship in a brand theme, which is the version to reach for when the section needs to read as a statement rather than a footnote.
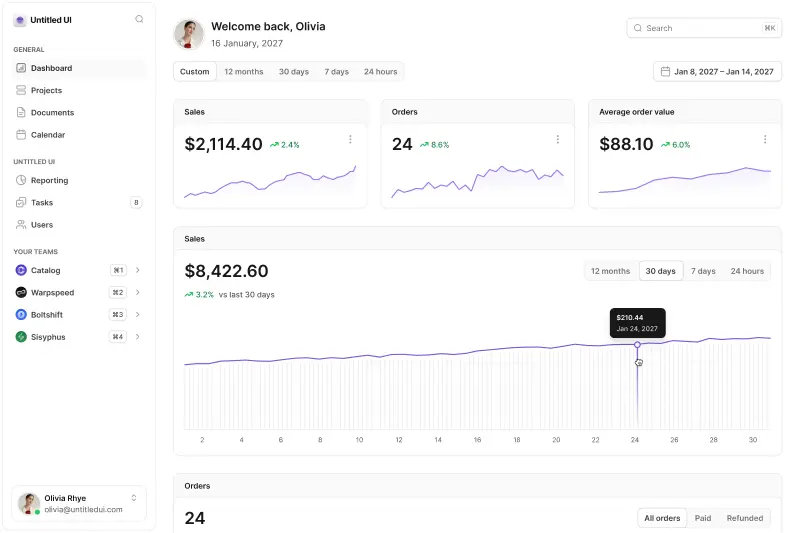
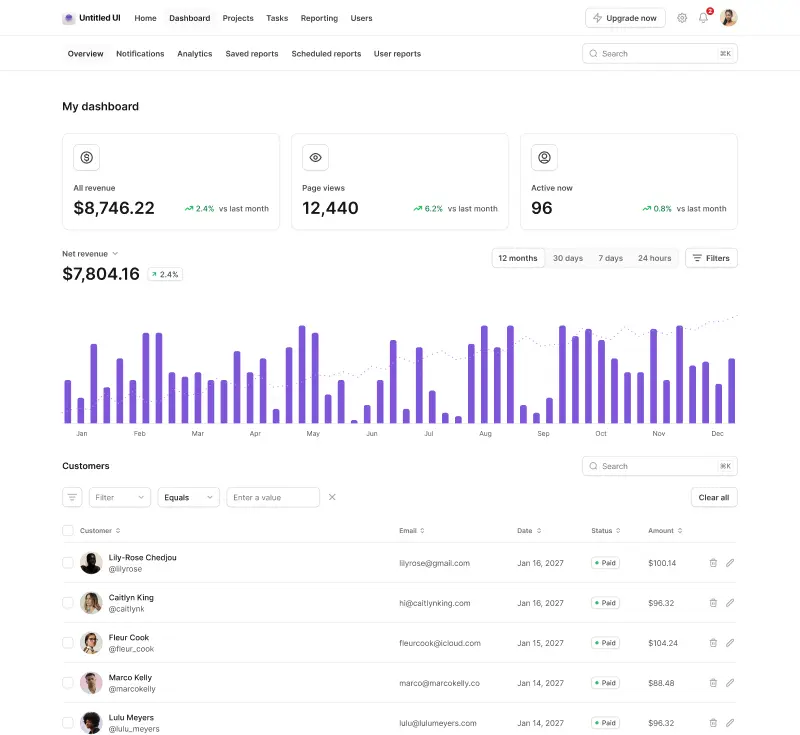
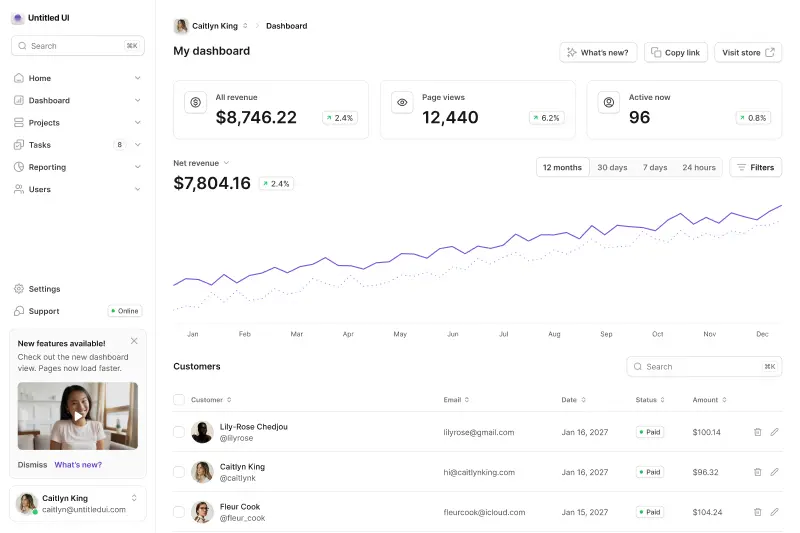
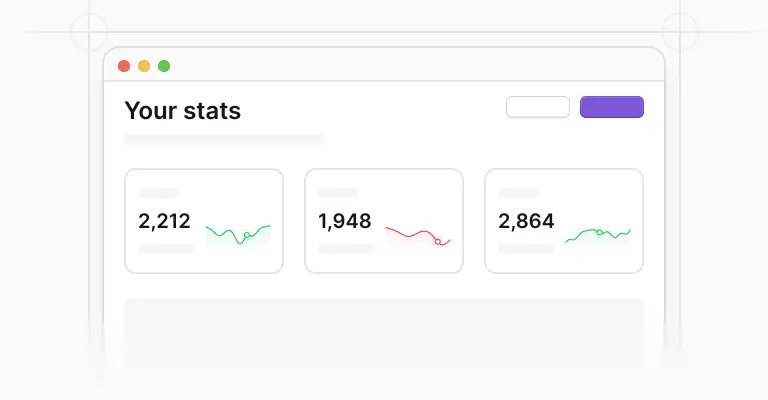
These are marketing metrics rather than product ones. The dashboard metric cards are a separate component built for data that changes, with charts and trend indicators.
Sections compose into pages
Metrics sections rarely stand alone. They work as the beat between a header section and the first features section, or as the credibility layer next to testimonials and social proof.
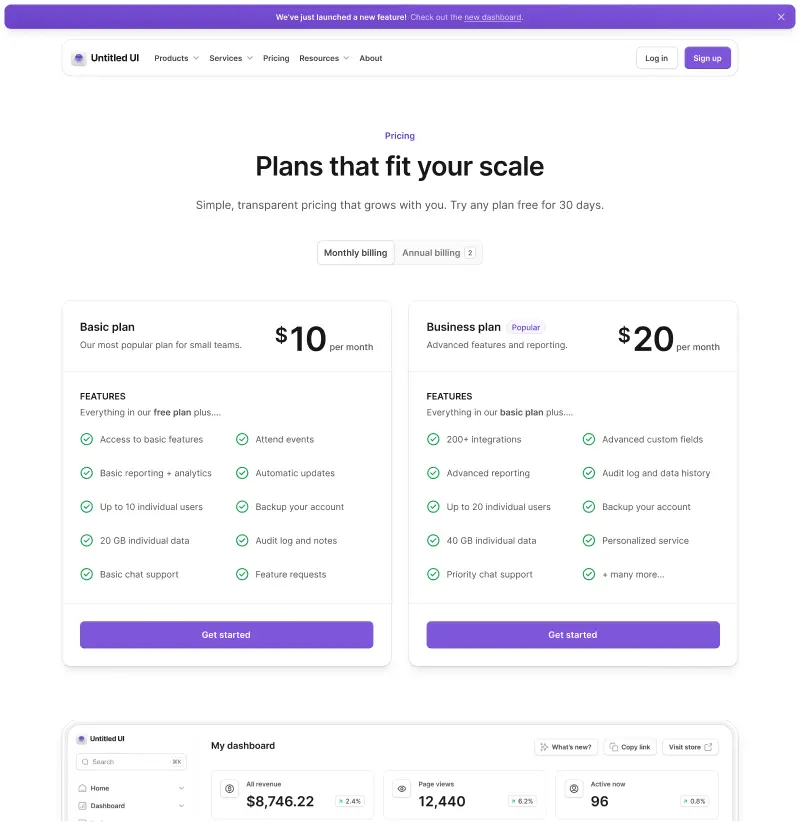
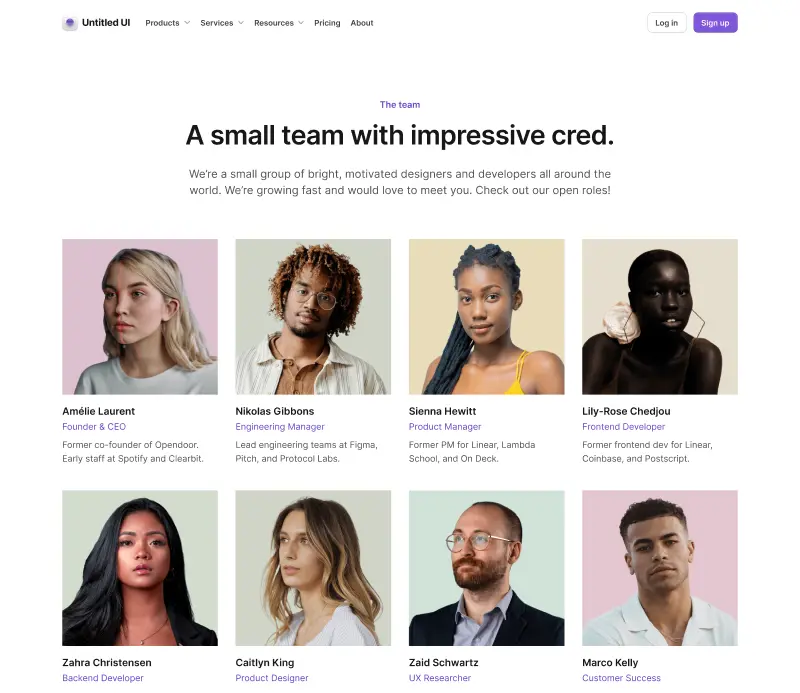
The landing page examples and pricing page examples place them exactly there, and because every example is assembled from these components, lifting your metrics row higher up a page takes about as long as dragging it there. Each layout is drawn at 1,440px and 375px in light and dark, and the photographic versions take your own imagery or a placeholder from the free avatar library for the team shots.
In code, the same rows are already built. Untitled UI React metrics sections are open source, built with Tailwind CSS and React Aria, so the numbers reflow the same way in the browser as they do in the file.
Frequently asked questions
How many metrics should a section show?
Three or four. Two looks thin, five starts to read as a table, and the desktop layouts here are built on a grid of 384px items that lands naturally on three or four across.
Pick the ones that answer a question a visitor already has, usually scale, reliability, or speed, and drop the metric that only exists because it was easy to pull.
What if our numbers are not big yet?
Use a different kind of number. Percentages, averages, ratings, and time savings read as strong at any company size, while raw counts invite a comparison you will lose.
A specific small number beats a vague large one too: "92 teams in healthcare" is more persuasive to a healthcare buyer than "thousands of users". Never round upward into something you cannot evidence.
Should the numbers animate and count up?
Usually not. A counting animation delays the one piece of information the section exists to deliver, and if it fires on scroll, people who scroll fast see it half finished.
If you use it anyway, keep it under a second, start close to the final figure rather than at zero, and respect reduced motion settings so the number simply appears for anyone who has asked for less movement.
Are these metrics sections included in the free version?
The metrics sections are part of the paid Untitled UI Figma kit. See pricing for what is included.
The 100% free Figma UI kit covers core components from the same system, and everything you build on it carries over if you upgrade later.
Is there a React version of these metrics sections?
Yes. Untitled UI React metrics sections are open source, built with Tailwind CSS and React Aria, and mirror these Figma layouts, including the card and split image versions.
Foundation Figma components and styles
Figma base components


Shared Figma assets
Application UI/Dashboard examples
Application UI/Dashboard Figma components
Marketing website examples
What is Untitled UI?



















Untitled UI is the best $ I've spent on my business in a long time. I'm going to keep using it and recommending it to every designer I know.


Over the years we've featured hundreds of UI kits on UXCrush, but Untitled UI is by far the most comprehensive and detailed I've seen yet. A must have for any designer!

I've used all UI kits on the market. I can say without a doubt that the Untitled UI kit is the best on the market. It covers everything a designer needs in a modern and efficient way.

Incredible, and keeps getting better. I’ve tried dozens of UI kits and Untitled UI is the only name you should care about. It stands head and shoulders above the rest.

Such a beautiful, detailed, and extensive UI kit. Untitled UI is the perfect foundation for any project. I highly recommend this huge time saver.

Untitled UI has been an amazing resource that I'm learning to rely upon to spin up ideas in no time. I think I might launch a startup pretty soon by mistake here!

The sheer scale, details, and organization of this kit is mind-blowing. It covers nearly everything a Designer could need in a modern, efficient and systematic way.

I'm super impressed with this. I love poking around in other peoples UI Kits to see how they think. This is probably one of the most comprehensive I've seen.

I'm super excited to use this for quick mockups of ideas in Figma. We're always trying to streamline our design process so we can move fast! Definitely recommend.

Untitled UI is easily the best UI kit I've used so far. It has an insane amount of components that are all incredibly well-built. I don't even know how many hours this will save.

The attention to detail and thought Jordan has put into this UI kit is unparalleled.

Untitled UI is incredibly well-organized and the attention to detail is great. I highly recommend this kit to any designer that wants to create beautiful designs fast.

What an awesome Figma kit... it's an absolute game changer. This is the perfect base for any design system. The size and attention to detail is next level.

We've been using Untitled to build Himalayas 2.0 and have finished a complete redesign in just a few days. It has everything we need already pixel-perfect.