










Figma metric components


Metric cards in Figma: value, trend delta, and comparison period
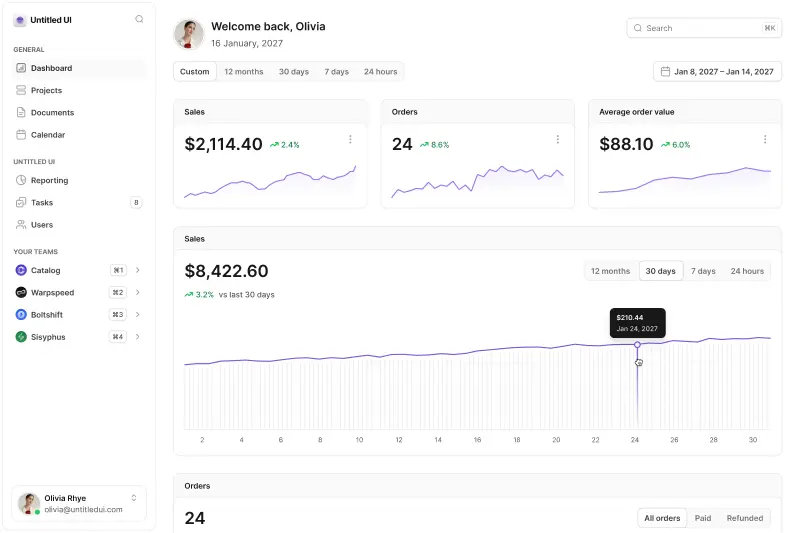
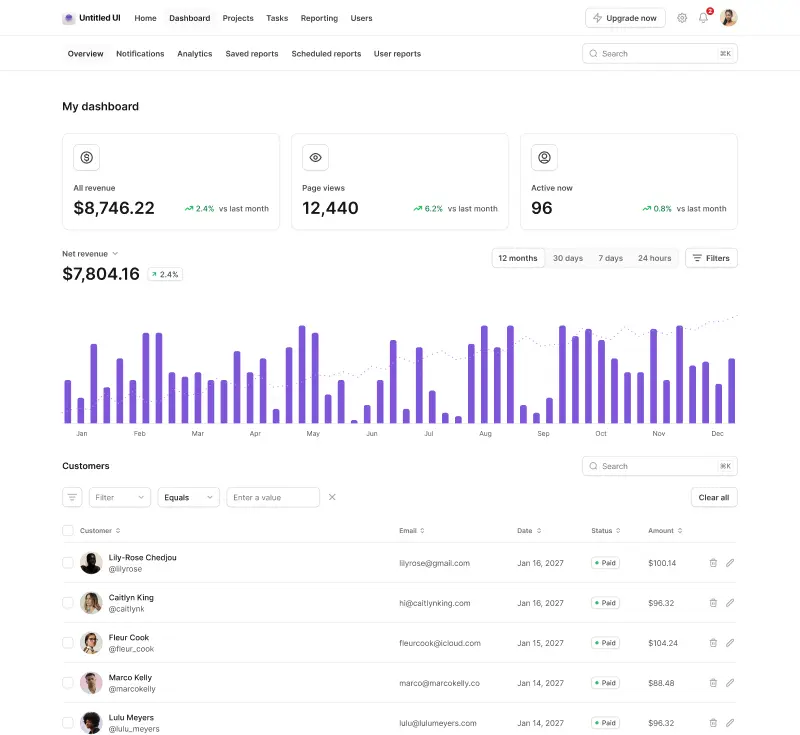
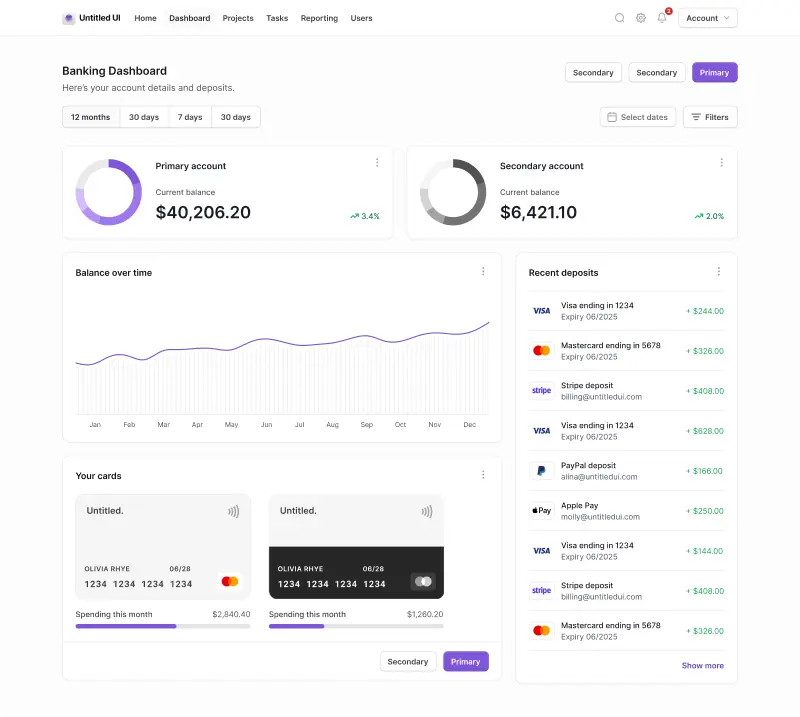
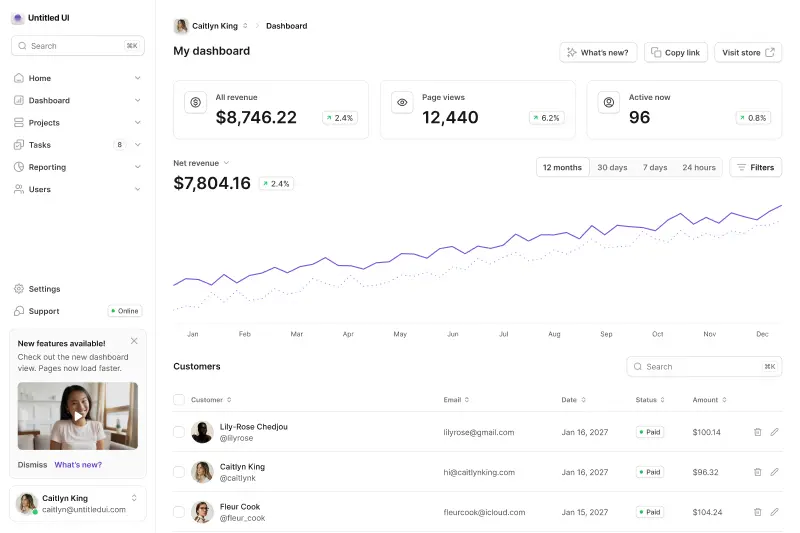
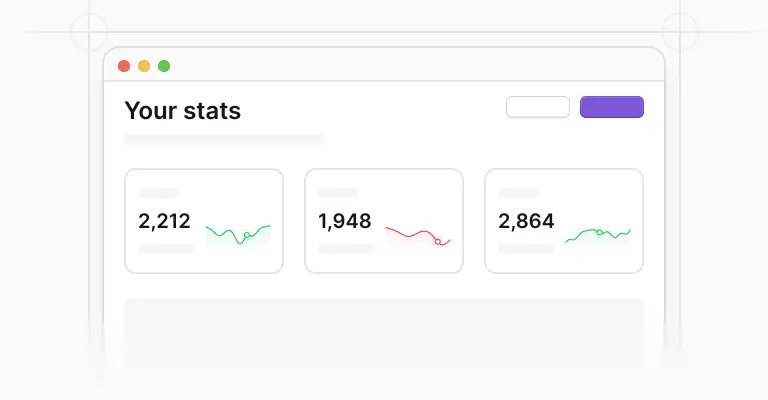
Almost every dashboard opens the same way: a row of three to five big numbers across the top, before any chart gets a look in. That row is the part people actually read. They scan it, decide whether anything is wrong, and only then look further down the page.
Metric cards also show up well outside dashboards, in billing summaries, campaign reports, project overviews, and the header of a settings page. The 4 components and 36 variants above cover the card layouts, the mini charts, and the change indicators that go inside them.
Three things a card has to say
The value, the direction it moved, and what it moved against. The third one gets dropped constantly. A card reading "$47,290" with a green "+12%" underneath tells you nothing until it says compared to what: last week, last month, the same month last year.
Twelve percent up on a bad January is a different story from twelve percent up on a record December. Every trend delta needs its comparison period attached in text, and that is a copy decision your components should force rather than leave optional.
The other half of a good top row is restraint. Three to five cards, chosen because someone checks them daily, is a row; nine cards weighted equally is a wall, and the dashboard examples are laid out on that assumption.
Nine card types, desktop and mobile
The Type property runs Simple, four icon layouts from Icon 01 to Icon 04, and four chart layouts from Chart 01 to Chart 04, which covers a plain number, a number with an icon, and a number with a sparkline built into the card.
Actions toggles a button row onto the bottom of the card for the cases where a metric is also a link into a report. Breakpoint gives you a 388px desktop card and a 343px mobile card, and the simple desktop card is 106px tall, which is the number to build your grid rhythm around.
Do not confuse these with the metrics sections, which are the stat rows built for marketing pages; those are designed to impress, these are designed to be checked.
The sparkline and the delta move together
The mini chart is its own component set, 56px tall and 112px wide for most of its curves, with twelve styles across Realistic 01 to 03, Wavy 01 to 07, Straight, and Layers, and each one exists in a positive and a negative trend.
The change indicator comes in three styles, also in positive and negative. So flipping a card from good news to bad news is a couple of variant swaps and the sparkline never ends up climbing while the arrow points down, which is the sort of detail that survives right up until someone screenshots the mockup for a board deck.
Keep the arrow doing the work and let color reinforce it: MDN's guidance on color and luminance is blunt that hue alone should never carry a distinction, and red-versus-green deltas are the textbook example.
Assembling the row
The mini charts and change indicators live as their own component sets, which is what lets you change the curve or the delta style inside a card without touching the card, and Figma's component properties put the toggles and text fields in one panel instead of five nested layers. Every card exists in a light and a dark version. For the full-size charts that sit under the row, the line and bar charts use the same styles and spacing.
When it is time to build, the same cards exist in code. Untitled UI React metrics are open source, built with Tailwind CSS and React Aria, matching these components down to the positive and negative trend treatments.
Frequently asked questions
What should a metric card show?
A label, the value, the change since a stated comparison period, and nothing else unless it earns its place.
The comparison period is the part teams forget: a delta with no timeframe attached cannot be interpreted. If a card needs a second number to make sense, that is usually a sign the metric wants a chart or a table instead.
How many metrics should sit at the top of a dashboard?
Three to five. That is enough to cover the numbers someone checks daily and few enough that the row still reads as a hierarchy rather than a grid of equals.
Everything else belongs in charts, tables, or a drill-down. A row of nine cards is a way of saying that nothing on the page is more important than anything else.
How do I add a sparkline to a metric card in Figma?
Use the Chart 01 to Chart 04 card types, which already have the mini chart in place, then swap the curve.
The mini chart is a component set 56px tall with twelve styles, from realistic and wavy curves to a straight line, each in a positive and a negative version, so you can match the shape to the direction the number actually moved.
Are these metric components included in the free version?
The metric cards are part of the paid Untitled UI Figma kit. See pricing for the full contents.
If you want to try the system first, the 100% free Figma UI kit includes core components and styles from the same library.
Is there a React version of these metrics?
Yes. Untitled UI React metrics are open source, built with Tailwind CSS and React Aria, and mirror these Figma components, including the positive and negative trend treatments and the desktop and mobile sizes.
Foundation Figma components and styles
Figma base components


Shared Figma assets
Application UI/Dashboard examples
Application UI/Dashboard Figma components
Marketing website examples
What is Untitled UI?



















Untitled UI is the best $ I've spent on my business in a long time. I'm going to keep using it and recommending it to every designer I know.


Over the years we've featured hundreds of UI kits on UXCrush, but Untitled UI is by far the most comprehensive and detailed I've seen yet. A must have for any designer!

I've used all UI kits on the market. I can say without a doubt that the Untitled UI kit is the best on the market. It covers everything a designer needs in a modern and efficient way.

Incredible, and keeps getting better. I’ve tried dozens of UI kits and Untitled UI is the only name you should care about. It stands head and shoulders above the rest.

Such a beautiful, detailed, and extensive UI kit. Untitled UI is the perfect foundation for any project. I highly recommend this huge time saver.

Untitled UI has been an amazing resource that I'm learning to rely upon to spin up ideas in no time. I think I might launch a startup pretty soon by mistake here!

The sheer scale, details, and organization of this kit is mind-blowing. It covers nearly everything a Designer could need in a modern, efficient and systematic way.

I'm super impressed with this. I love poking around in other peoples UI Kits to see how they think. This is probably one of the most comprehensive I've seen.

I'm super excited to use this for quick mockups of ideas in Figma. We're always trying to streamline our design process so we can move fast! Definitely recommend.

Untitled UI is easily the best UI kit I've used so far. It has an insane amount of components that are all incredibly well-built. I don't even know how many hours this will save.

The attention to detail and thought Jordan has put into this UI kit is unparalleled.

Untitled UI is incredibly well-organized and the attention to detail is great. I highly recommend this kit to any designer that wants to create beautiful designs fast.

What an awesome Figma kit... it's an absolute game changer. This is the perfect base for any design system. The size and attention to detail is next level.

We've been using Untitled to build Himalayas 2.0 and have finished a complete redesign in just a few days. It has everything we need already pixel-perfect.